Math Sharpeners

Browse by Topics

BAR GRAPH WORKSHEETS

Bar graphs are also known as bar charts and it is a pictorial representation of grouped data. It is one of the ways of data handling. Bar graph is an excellent tool to represent data that are independent of one another and that do not need to be in any specific order while being represented. The bars give a visual display for comparing quantities in different categories.

Bar Graph Worksheets
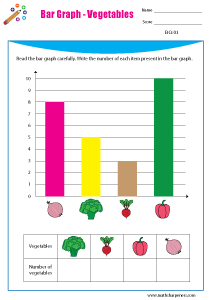
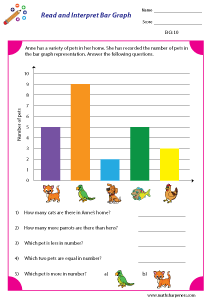
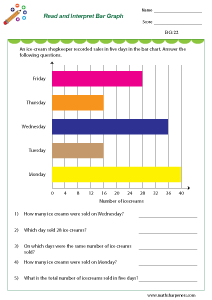
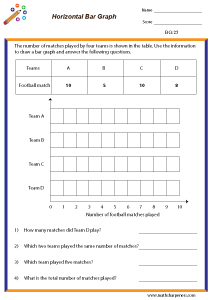
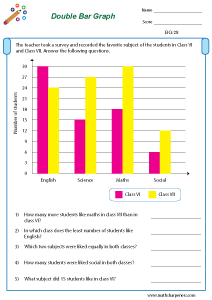
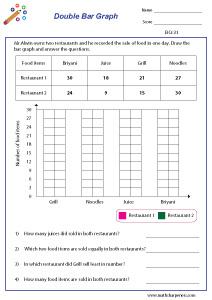
Reading Bar graph

Reading the bar graph with given images and answer the questions carefully.

Drawing Bar graph

Using the data provided with images, draw a bar graph on the grid given below. 

Count and Draw Bar graph

Count the number of objects and draw a bar graph, according to the data.

Read and Interpret Bar graph

Read the data given and interpret the data. Answer the questions.

Draw and Interpret Bar graph

Read and draw the bar graph for the given data. Answer the questions.

Bar graph & Tally Marks

Draw the bar graph from the given tally marks and the objects.

Interpret Bar graph With Tally Marks

Draw the bar graph from the given tally marks and also answer the questions.

Read Horizontal Bar graph

Read and interpret bar graph. Answer the questions.

Horizontal Bar graph

Read the data and draw the horizontal bar graph.

Double Bar graph - Type 1

A double bar graph (or double-bar chart) is used to compare two sets of data side by side.

Double Bar graph - Type 2

Read the two sets of data and draw the double bar graph. Answer the given questions.